A Package for Machine Learning Evaluation Reporting
When working on machine learning projects, evaluating a model’s performance is a critical step. The ML-Report-Kit is a Python package that simplifies this process by automating the generation of evaluation metrics and reports. In this post, we’ll take a closer look at what ML-Report-Kit offers and how you can use it effectively.

Introduction
ML-Report-Kit is designed to help data scientists and machine learning practitioners create comprehensive evaluation reports for supervised learning models. It provides a straightforward way to generate various metrics and visualizations that can aid in understanding model performance.
To use ML-Report-Kit, you first need to install it. You can do this via pip:
pip install ml-report-kit
Once installed, you can easily create a report by following these steps:
from ml_report import MLReport

report = MLReport(y_true, y_pred, y_pred_prob, class_names)
report.run(results_path="results")
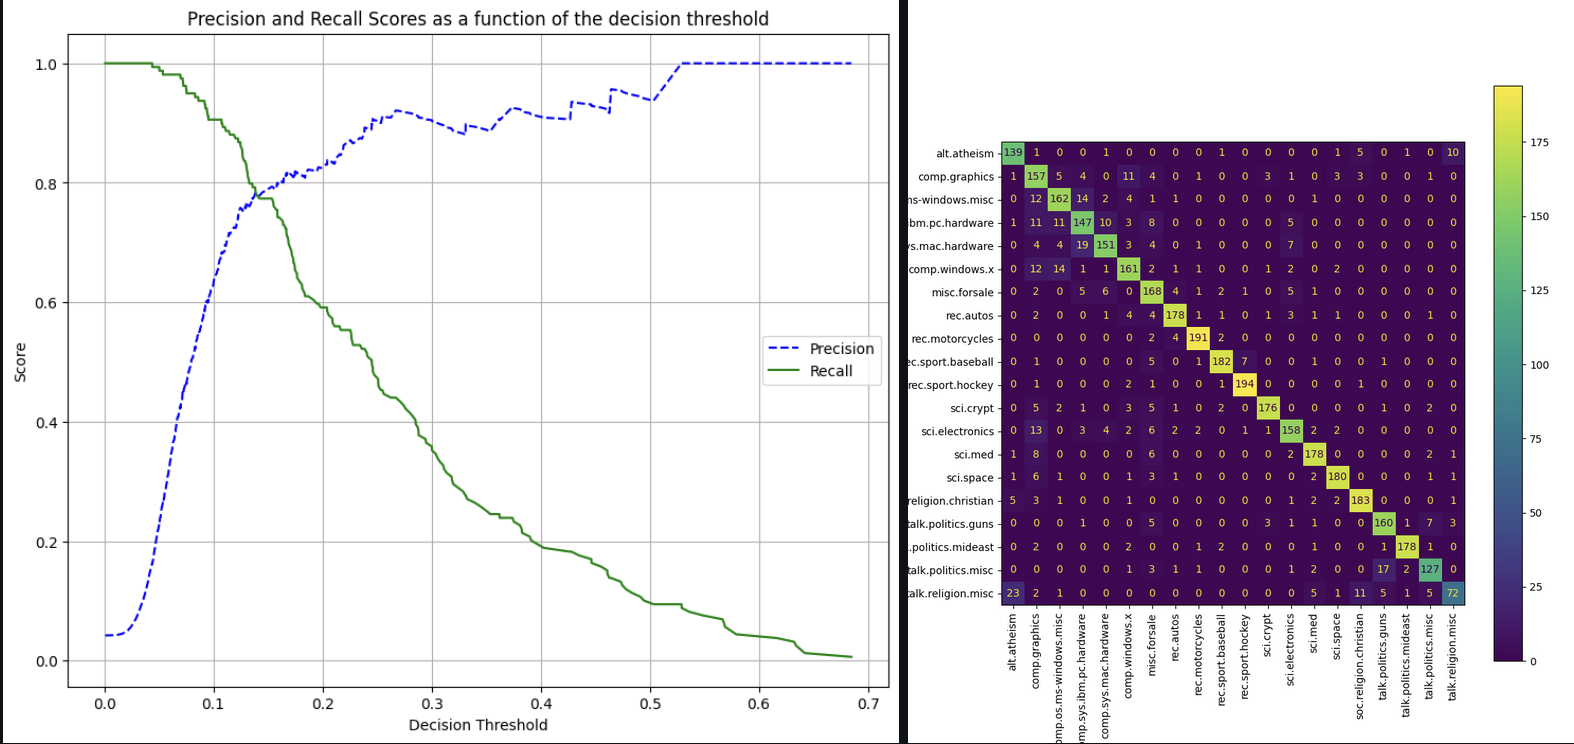
This code will generate a report with various metrics, saving it the results folder, containing:
- Classification Report: Detailed metrics for each class, including precision, recall, and F1-score.
- Confusion Matrix: A visual representation of true vs. predicted classifications.
- Precision-Recall Curves: Graphs that show the trade-off between precision and recall at different thresholds.
- CSV Files: Data files containing detailed metric values for further analysis.
Running ML-Report-Toolkit on cross-fold classification
This example demonstrates how to use ml-report-kit in a cross-fold classification scenario generating reports for individual folds and the entire dataset. We’ll use the 20 Newsgroups dataset, a popular text classification dataset, to illustrate the process.
Install the following packages
pip install ml-report-kit
pip install scikit-learn
Run the code
import numpy as np
from sklearn.datasets import fetch_20newsgroups
from sklearn.model_selection import StratifiedKFold
from sklearn.pipeline import Pipeline
from sklearn.feature_extraction.text import TfidfVectorizer
from sklearn.linear_model import LogisticRegression

from ml_report_kit import MLReport

dataset = fetch_20newsgroups(subset='all', shuffle=True, random_state=42)
k_folds = StratifiedKFold(n_splits=3, shuffle=True, random_state=42)
folds = {}

for fold_nr, (train_index, test_index) in enumerate(k_folds.split(dataset.data, dataset.target)):
    x_train, x_test = np.array(dataset.data)[train_index], np.array(dataset.data)[test_index]
    y_train, y_test = np.array(dataset.target)[train_index], np.array(dataset.target)[test_index]
    folds[fold_nr] = {"x_train": x_train, "x_test": x_test, "y_train": y_train, "y_test": y_test}

all_y_true_label = []
all_y_pred_label = []
all_y_pred_prob = []

for fold_nr in folds.keys():
    clf = Pipeline([('tfidf', TfidfVectorizer()), ('clf', LogisticRegression(class_weight='balanced'))])
    clf.fit(folds[fold_nr]["x_train"], folds[fold_nr]["y_train"])
    y_pred = clf.predict(folds[fold_nr]["x_test"])
    y_pred_prob = clf.predict_proba(folds[fold_nr]["x_test"])
    y_true_label = [dataset.target_names[sample] for sample in folds[fold_nr]["y_test"]]
    y_pred_label = [dataset.target_names[sample] for sample in y_pred]

    # accumulate the results for all folds to generate a report for the entire dataset
    all_y_true_label.extend(y_true_label)
    all_y_pred_label.extend(y_pred_label)
    all_y_pred_prob.extend(list(y_pred_prob))

    # generate the report for the current fold
    report = MLReport(y_true_label, y_pred_label, y_pred_prob, dataset.target_names)
    report.run(results_path="results", fold_nr=fold_nr)

# generate the report for the entire dataset
ml_report = MLReport(all_y_true_label, all_y_pred_label, list(all_y_pred_prob), dataset.target_names, y_id=None)
ml_report.run(results_path="results", final_report=True)
This code will generate reports for each fold and the entire dataset, saving them in the results folder. The reports will include:
- classification reports with precision, recall, and F1-score for each class
- confusion matrices in both text and image formats
- confusion_matrix.png
- confusion_matrix.txt
- the precision-recall curve for each fold and the entire dataset in both raw CSV values and image formats
- precision_recall_threshold_
.csv - precision_recall_threshold_
.png
- precision_recall_threshold_
Where to get ML-Report-Kit
metrics classification evaluation_metrics 